Guide · Our CLV post-mortem
We Don't Beat the Closing Line — and Our Own Metric Was Hiding It
A post-mortem, written August 2026. We ran the one honest test of forecasting edge on our own record, failed it, and found a two-month-old bug that had been dressing the failure up as success. This is the full account, with the numbers we'd rather not have.
There is exactly one honest way to test whether a sports forecaster has an edge, and it isn't their win rate.
Win rate tells you almost nothing. A forecaster who only bets heavy favourites wins 70% of the time and loses money. One who only bets long shots wins 25% and might be printing. Profit is better but takes years to separate from luck — at 222 settled picks our own 95% confidence interval on ROI runs from −7% to +19%, which is another way of saying we cannot yet distinguish ourselves from a coin.
The test that works faster is closing line value. Take the price you got, compare it to the market's final price before kickoff, and ask: did you get a better number than the market settled on? The closing line is the most efficient consensus available — thousands of bettors, sharp money included, all pushing it toward truth. If you consistently take prices better than the close, you are finding things before the market does. If you don't, you aren't, and your profit is variance wearing a suit.
We ran that test on ourselves. Here is the result.
We beat the close 33% of the time
Across the 177 picks where we can measure it correctly, we got a better price than the closing line 58 times. That's 32.8%.
A pipeline with real edge sits comfortably above 50%. Ours sits well below. Not marginally below — below by enough that the direction isn't in question.
Broken out by market — picks, share that beat the close, mean CLV per pick:
- Totals (over/under): 69 picks · 33% beat the close · mean −2.75%
- Two-way moneylines (tennis, baseball, NBA, DNB): 58 picks · 31% · −1.13%
- Handicaps / spreads: 43 picks · 35% · +0.40%
- Both teams to score: 5 picks · 0% · −8.39%
Every family is at or below about a third. The only one with a positive mean is handicaps, and +0.40% on 43 picks is indistinguishable from zero.
The plain reading: the market prices these games better than we do. When we disagree with the closing line, the closing line is usually right.
The part we did not expect
We found this while writing it up, and it is the more useful finding.
Our public scorecard had been reporting average CLV of +4.69% — displayed as our "edge-vs-market check." That number said we were beating the market. The number above says we are losing to it by a wide margin. Both were computed from the same database.
The reason is a bug in how we de-vig a three-way market.
To compare your price to a fair closing price you first have to strip the bookmaker's margin. You do that by normalising across all the outcomes: take the implied probability of each, add them up, and divide. Our implementation took the selection's price and the opposite team's price, normalised across those two, and called it fair.
That's correct for a two-way market. A tennis match has two outcomes. An over/under has two outcomes. A handicap has two outcomes.
Football has three. Home, draw, away.
Our code split the closing lines into "our team" and "the other team," and the draw — carrying roughly a quarter to a third of all probability — was silently dropped on the floor. Normalising over a denominator that's missing 30% of the probability mass makes your selection look far more likely than it is, which makes the fair closing price look far shorter than it is, which makes your posted price look like a bargain against it. Every single time.
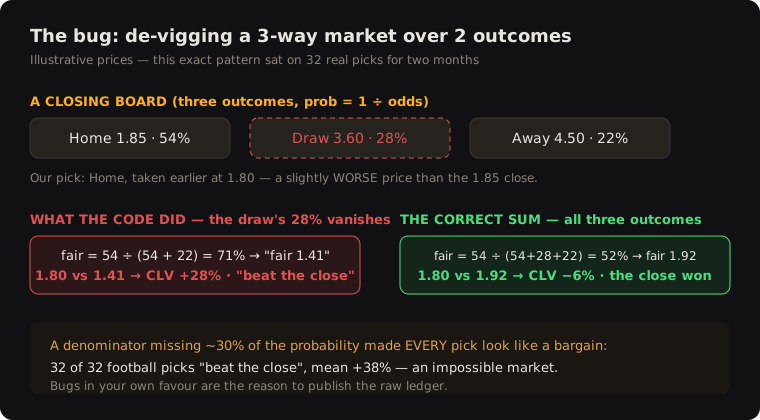
The result was that all 32 of our football 1X2 picks recorded positive CLV — a 100% beat rate, with a mean of +38%. Not one of them showed negative. A market where you beat the close 100% of the time does not exist, and that impossibility was sitting in our data for two months while we read past it.
Ten of those rows were provably impossible on their own terms. One pick took 2.30 and the market closed at 2.94 — we got a materially worse price than the close, which can only be negative CLV, and it was recorded as +3.3%. Another took 1.82, closed at 1.83, and recorded +34.5%. Those rows contradicted themselves in the database for two months and nobody read them closely enough to notice, us included.
There's a second, quieter version of the same bug. Because a draw pick names neither team, the code that decides which side you backed returned "no idea" and gave up — so every pick we made on the draw got no CLV at all. The one market where our reasoning is most distinctive was the one we weren't measuring.
The 32 picks were enough to drag the blended average from −1.50% to +4.69% and put a reassuring number on the front of the scorecard.
The bug flattered us. That is the direction bugs in your own favour always seem to run, which is the entire reason to publish the raw ledger and let other people check the arithmetic.
We can't retroactively repair those 32 numbers, and it's worth saying why: we stored the closing price of the side we backed, but never the draw's closing price. The input the correct calculation needs was thrown away at capture time. So rather than leave 32 flattering numbers on a public page, we deleted them. The record now shows no CLV for those picks and the corrected average across the picks we can measure. Every pick from here on is computed properly.
The second bug went the other way
While auditing the fix we found a different error — and this one had been hurting us.
One of our picks was a draw-no-bet written as "Bodø/Glimt 0" — a zero handicap, meaning a draw refunds the stake. Our market parser only recognised handicaps with an explicit plus or minus sign, so the unsigned "0" fell through and the pick was stored as an ordinary moneyline. The match finished 3-3. On a moneyline a draw is a loss; on a zero handicap it's a push. The public record charged us −1.00u for a bet that should have returned the stake.
We re-ran the corrected grader against all 186 settled non-tennis picks. It disagreed with exactly one stored result — that one. The record moved from 117–105 to 117–104 with the first push in its history, gaining a unit.
We're including this because it's the counterweight that makes the first bug believable. If every error we ever disclosed happened to inflate our numbers, you'd be right to wonder what we weren't disclosing. The errors run both ways; the commitment is that the ledger gets corrected in public whichever way it cuts. The on-chain hash of that pick never changed — what we committed to before kickoff is immutable; what we graded it afterwards is just arithmetic, and arithmetic can be re-checked by anyone.
What we had already concluded, and why it still stands
This isn't the first evidence we had. Back in July, after 119 settled picks, we ran a formal review: −0.4% ROI, a CLV beat rate we recorded as 42%, and — the most damning part — claimed-edge calibration that was flat to inverted. We had the model output a probability for every pick and compared it to the odds-implied probability. In every band of claimed edge, actual win rate landed at or below what the price implied. The bigger our claimed edge, the worse we did.
Our confidence had no predictive content whatsoever.
That 42% was computed with the broken function, so the true figure was lower — the honest number is nearer the 33% above. The conclusion doesn't change; it sharpens. And the segment economics from that review were brutally clear about where the money went:
- Tennis moneylines: −3.36u over 21 picks
- Football totals: −2.09u over 51 picks — 43% of our entire volume, negative
- Both teams to score: −3.33u over 5 (removed from the product)
- Handicaps: +8.29u over 38 picks, the only profitable family
So we stopped asking the market what to think
The failure had a specific shape. Our pipeline computed a de-vigged fair price, compared it to the posted price, and published when the gap was big enough. Read that again: the market's own number was the input to every decision. We weren't forecasting matches. We were forecasting the bookmaker's margin, and then congratulating ourselves when a soft line agreed with us.
So at the end of July we deleted it. All of it — the edge floors, the calibration clamp, the price-vs-field gate, the auto-suspension logic. Every filter that took the market price as an input is gone from the codebase.
What replaced it: three AI characters forecast the result from research only — named absentees, manager quotes, the tactical mismatch, rest and travel, weather. No prices in the room. Only after they've committed to a scoreline does anyone look at the board, and then only to find which market pays that forecast best. A pick publishes when at least two of the three back it.
The de-vig calculation survives as a descriptive statistic. It decides nothing.
What we are not claiming
We are 117–104 across 222 settled picks (plus one push), +6.1% ROI at flat stakes, with a 33% CLV beat rate.
Those two facts are in tension and we're not going to resolve it for you. A positive return alongside a poor CLV beat rate has three possible explanations: we're lucky; we have edge in something CLV doesn't capture; or the sample is too small to mean anything. At 222 picks, with an ROI interval spanning −7% to +19%, the honest answer is that variance is the most probable explanation and anyone telling you otherwise about a two-month record is selling something.
We also can't yet tell you whether the research-first rewrite worked. It has been live since the end of July. Picks published under it come from a materially different engine than the 119-pick baseline, so comparing across that line compares two regimes rather than measuring one. Ask us in a few hundred picks.
What we can tell you is that every pick is hashed and committed to a public append-only record before kickoff, that the losers stay on the scorecard, and that when we find a bug — whichever way it cuts — we write it up.
The numbers above are a snapshot from early August 2026; the scorecard is live and has moved since. If you want to check any of this, the whole ledger is public: threepundits.com/scorecard.
This is an account of our own record, not betting advice. 18+ · bet responsibly.